DISCLAIMER: There are significant risks involved in making any investment in crypto assets. None of the information presented herein is intended to form the basis of any offer or recommendation or have any regard to the investment objectives, financial situation, or needs of any specific person, and that includes you.
In one line: Seems it’s about that time to remind everyone that crypto is perhaps the most reflexive asset class in history that everyone wants when the price is high and no one wants when the price is low…we may not have bottomed yet, but we’re certainly at interesting levels for long-term thinkers.
Protocol Summary:
- Network Revenue fell 86.0% $1.96B to $274.12M This measures the dollar value of the total transaction fees paid by users during the quarter. The decline can be attributed to a drop in on-chain activity as a result of broader weakness in the markets. There was significantly reduced demand to trade, speculate, or take on leverage amidst the bearish macro backdrop. Of this, $200.15M (73%) was burned via the fee-burning mechanism introduced in EIP-1559.
- The ETH Inflation Rate rose 7.7% from 0.79% to 0.85% This measures the growth of the Ether supply during the quarter. The increase in inflation is likely due to reduced demand for blockspace. As users transacted less, fewer ETH was burned (permanently removed from the circulating supply) via EIP-1559.
- The Average Number of Daily Active Addresses (DAA) increased 3.08% from 491,271 to 506,384 This measures the average number of unique wallet addresses to interact with the network for each day in the quarter. Although overall speculative activity declined, this bump in DAA can likely be attributed to reduced gas costs. As the cost of transacting fell in tandem with blockspace demand, this increased the ability for new individuals, contracts, and/or bots to transact on Ethereum.
- The number of ETH staked increased 80.2% from 7.81M to 14.08M This tracks the amount of ETH staked on the Beacon Chain. This growth in stake was due to anticipation of the merge, as well as the adoption of liquid staking services, which enabled users to earn staking rewards having their ETH holdings remain liquid. These protocols saw their share of total Beacon Chain deposits increase from 35.3% to 46.3% Y/Y.
Ecosystem Summary:
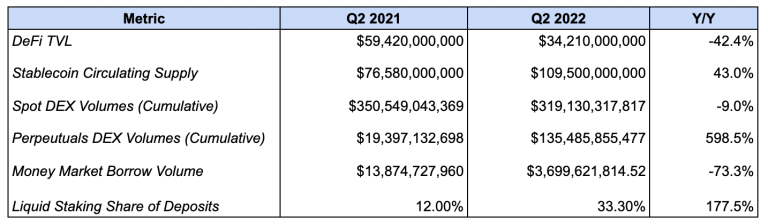
- DeFi TVL shrank 58.6% from $76.27B to $31.55B This measures the value of tokens deposited into Ethereum based DeFi protocols. This decline can be attributed to bearish market conditions, as much of DeFi TVL is made up of volatile assets which have declined in price like ETH and wBTC. The drop is likely also fueled by liquidity outflows driven by the fall in on-chain yields which has made deploying capital less attractive.
- Stablecoin Circulating Supply increased 20.9% from $87.82B to $106.20B This measures the value of dollar-pegged stablecoins that are issued and/or circulating on Ethereum. The growth has been driven by demand to hold stablecoins as cash positions and a combined $21.8B increase in the supply of USDC, BUSD, DAI and MIM on the network. This has offset a $3.6B decline in the circulating supply of USDT and “other” stablecoins.
- Spot DEX volumes declined 31.6% from $281.68B to $192.73B This tracks the total trading volumes across decentralized spot exchanges deployed on Ethereum. This decline is likely attributed to slumping market conditions. As discussed above, bearish conditions have diminished demand to speculate, which given that trading activity is positively correlated to price action, has led to lower trading volumes.
- NFT Marketplace Volumes fell 75.0% from $8.32B to $2.08B This measures the trading volume on NFT marketplaces such as OpenSea, LooksRare, and others. The decline in trading activity can be attributed to weakness in the general crypto market, as well as due to a decrease in speculative activity as a result of cratering NFT prices. As with ERC-20s, NFT trading volumes are positively correlated to price action.
- The Daily Average NFT Traders grew 67.8% from 13,861 to 23,254 This measures the average number of users to trade NFTs each day during the quarter. This bump is likely due to the broader awareness of the ecosystem among retail users as well as the maturity of NFT market structure. It is however down from last quarter (29,289).
- L2 TVL increased 97.1% from $2.40B to $4.73B This measures the value transferred onto optimistic rollups, zero-knowledge rollups, and validiums that settle to Ethereum. This increase in TVL can largely be tied to liquidity inflows into generalized rollups, like Arbitrum and Optimism. The two combined hold ~$3.9B, which represents an 81.5% share of the value on these networks.
Ecosystem Results Table:


About Ethereum
Ethereum is an open-source, decentralized blockchain network. Ethereum is a technology that’s home to digital money, global payments, and applications. The community has built a booming digital economy, bold new ways for creators to earn online, and so much more. It’s open to everyone, wherever you are in the world – all you need is the internet (Taken from the Ethereum.org website.)
About This Release
This release is not a release of Ethereum or the Ethereum foundation.
Source: Bankless (highly recommend following / subscribing to their regular updates – one of the best sources of data for learning and keeping on top of Web 3)
Image Cred: https://www.cryptonewsz.com/much-awaited-ethereum-merge-is-done-will-eth-be-impactful/
